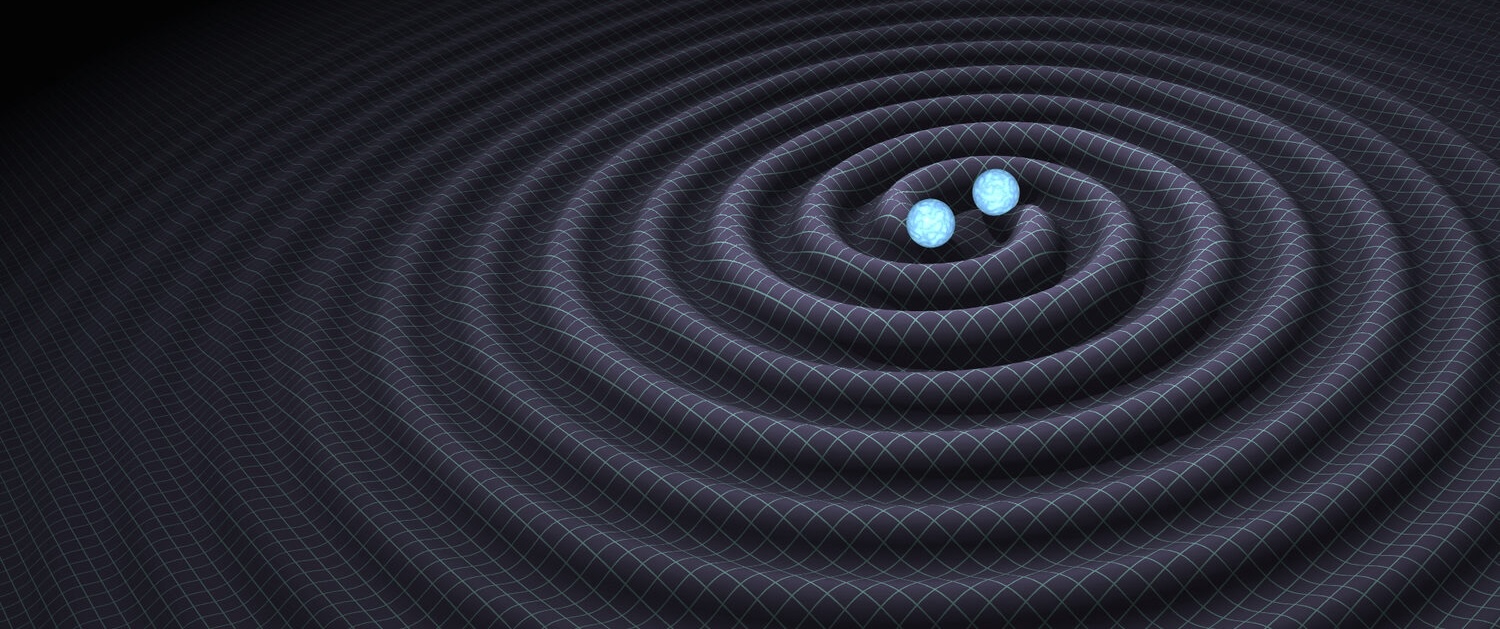
Gravitational waves (GWs) are small ripples in the geometry of space-time, predicted to exist by Einstein’s General Theory of Relativity, and propagating at the speed of light. We hope to detect GWs emitted by sources at astrophysical distances by using large laser interferometers. The current global network of such detectors consists of the LIGO observatories in the USA (LIGO-Hanford in Washington, LIGO-Livingston in Louisiana), the French-Italian Virgo Observatory in Italy and the German-British detector GEO600 in Germany. Among the types of GW sources, rapidly rotating neutron stars, that are not perfectly symmetric around their rotation axis, are expected to emit GWs continuously as they spin. The size of the asymmetry can be described by a parameter called the ‘ellipticity’. Neutron stars are expected to have very small ellipticities and most of them are thousands of light-years away, so we expect that the GWs reaching Earth are very weak. Nevertheless, by analyzing a long stretch of data with carefully prepared software, we hope to pick a very weak signal out of the noise.
The way to search for continuous GW signals depends on how much about the source is known. At present, about 2000 neutron stars in our Galaxy have been identified by their radio, X-ray or gamma-ray emissions, but our Galaxy is estimated to contain roughly 100 million neutron stars, so all-sky searches for continuous GWs might detect new ones and tell us about their structure. However, brute-force all-sky searches are quite computationally limited and would require more computer resources than exist on the Earth. The reason is that one needs to search for unknown sources located everywhere in the sky, with signal frequency as high as a few kilohertz and with a wide range of frequency derivative (also called spindown), i.e. the rate of change of the frequency. The ideal data analysis strategy used to extract the faint continuous wave signals from the detector noise is given by the coherent matched filtering method. However, this technique becomes computationally prohibitive when data stretches of the order of months or years are used and a wide fraction of the parameter space is searched over. Hence, to search for these signals using a realistic amount of computing power, we use a ‘hierarchical’ approach (based, for this search, on the Hough-transform) in which the entire data set is broken into shorter segments, each of which is analyzed coherently on timescales of about one day. Afterwards, the information from the different segments is combined incoherently (which means that the phase information is discarded). By distributing the computation work through the volunteer computing project Einstein@Home, we can use a coherent integration time of a few tens of hours, improving thus the search sensitivity and providing at the same time an opportunity to involve the public in the search for GWs.
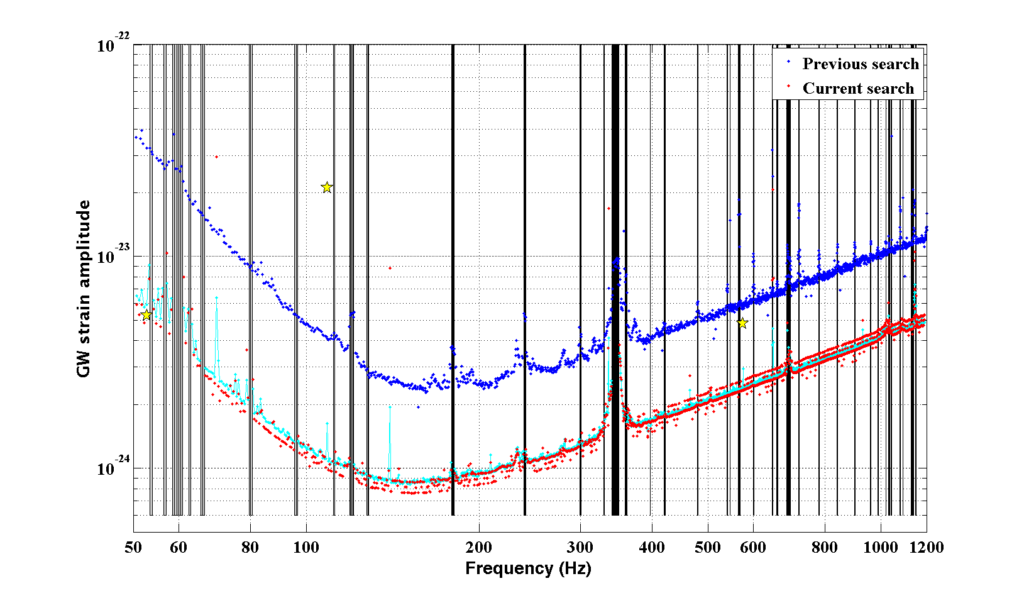
Figure 1. This plot shows the upper limits on the GW strain amplitude for a previous Einstein@Home search in early data from the fifth LIGO science run (blue curve) and for the search presented here (red curve). The three stars correspond to three simulated sources which were added to the data as a test. The curves represent the source strain amplitude at which 90% of simulated signals could be confidently detected. The vertical stripes correspond to 156 half-Hz frequency bands contaminated by instrumental disturbances and for which no upper limits are provided. The cyan curve shows an analytic sensitivity estimate, that agrees well with the red curve.
An all-sky search for continuous wave signals in the frequency range from 50 Hz to 1190 Hz and with frequency derivative range from ~ -20 ⋅ 10-10 Hz/s to 1.1 ⋅ 10-10 Hz/s has been recently performed to analyze LIGO data (both from Hanford and Livingston) collected in 2005-2007 during the fifth LIGO science run. Because the search is very computationally intensive, it has been carried out with the Einstein@Home project. Hundreds of thousands of host machines, that contributed a total of approximately 25000 CPU (Central Processing Unit) years, were needed to carry out the computations. No GW signals have been detected in this search, probably because there are no neutron stars emitting strongly enough in our frequency band to be detected at our sensitivity level. We quantify that conclusion by calculating upper limits on the GW strain amplitude: this is the smallest GW signal amplitude that we would have been able to detect with a 90% confidence. Since we have not detected any signal, we can exclude the existence of signals of the type that we have searched for with amplitudes greater than our upper limit value. For example, in the 0.5 Hz-wide band at 152.5 Hz, we can exclude the presence of signals with a GW strain amplitude of 7.6 ⋅ 10-25 or higher with a 90% confidence level. As shown in Figure 1, the upper limits set by this analysis (red curve) are three times more constraining than those (blue curve) set by the previous Einstein@Home search (for which more details can be found here). If we had a source spinning down at the maximum rate considered in the search, i.e. -2 ⋅ 10-9 Hz/s, and emitting all the lost rotational energy in GWs, at 152.5 Hz then we would be able to detect it as far away as 3.8 kpc (1 kpc = 1000 parsec = 3262 light-years) and with an ellipticity of ~ 10-4 [see Panels (a) and (b) in Figure 2].
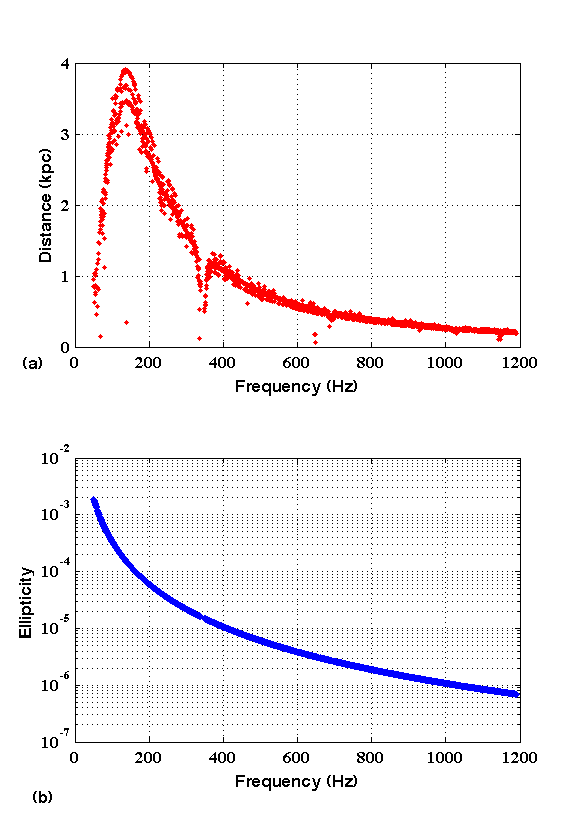
Figure 2. Panel (a) and (b) represent the distance range (in kpc) and the ellipticity, respectively, as a function of the frequency. Both the panels assume neutron stars spinning down solely due to gravitational radiation and at a rate of -2 ⋅ 10-9 Hz/s. In these plots, the 156 half-Hz frequency bands for which no upper limits are provided have been omitted.
The LIGO and Virgo interferometers are currently being upgraded with new, ‘Advanced’ instrumentation, with the goal of improving the current strain sensitivity by a factor of ten, with a thousandfold increase in the observable volume of space. In 2015 these interferometers are expected to be operational and will gradually improve their sensitivity. Both the advent of the Advanced LIGO/Virgo detectors and improvements in data analysis methods make us optimistic that we will eventually be able to make direct detections of GWs. Such detection will help us not only to understand the behaviour of space-time and matter under extreme conditions, but it will open a completely new window on the Universe, providing valuable information about the remarkable astrophysical objects that inhabit it.
Read more:
- Freely readable preprint of the paper describing the details of the full analysis and results: “Einstein@Home all-sky search for periodic gravitational waves in LIGO S5 data” by J. Aasi et al. (LIGO and Virgo collaborations).
- Web page with data used to make the main plots in the paper.