A recent analysis of observations made by the LIGO detectors has decisively ruled out the collision of two neutron stars or a neutron star and a black hole as being responsible for a gamma-ray burst (GRB) in a nearby galaxy. This result lends credence to the hypothesis that this GRB, observed in late 2005, was really a giant flare from a magnetar, potentially the most distant event of its kind ever observed. The publication describing the technical details may be found here.
On the morning of the 3rd of November 2005, a very short and violent burst of gamma radiation was detected by satellites designed to monitor the skies for explosive cosmic events. This so-called short-duration gamma-ray burst, known as GRB 051103, was so bright that it released more energy in gamma-rays over about a tenth of a second than our sun has in the last hundred thousand years. Put another way, this is equal to about ten thousand, billion, billion times the explosive power of the largest nuclear weapon ever developed. Triangulation of the observations by the various satellites revealed that the explosion may have occured in the galaxy M81 which lies a mere 12 million light years from the Earth; practically next door in cosmic terms!
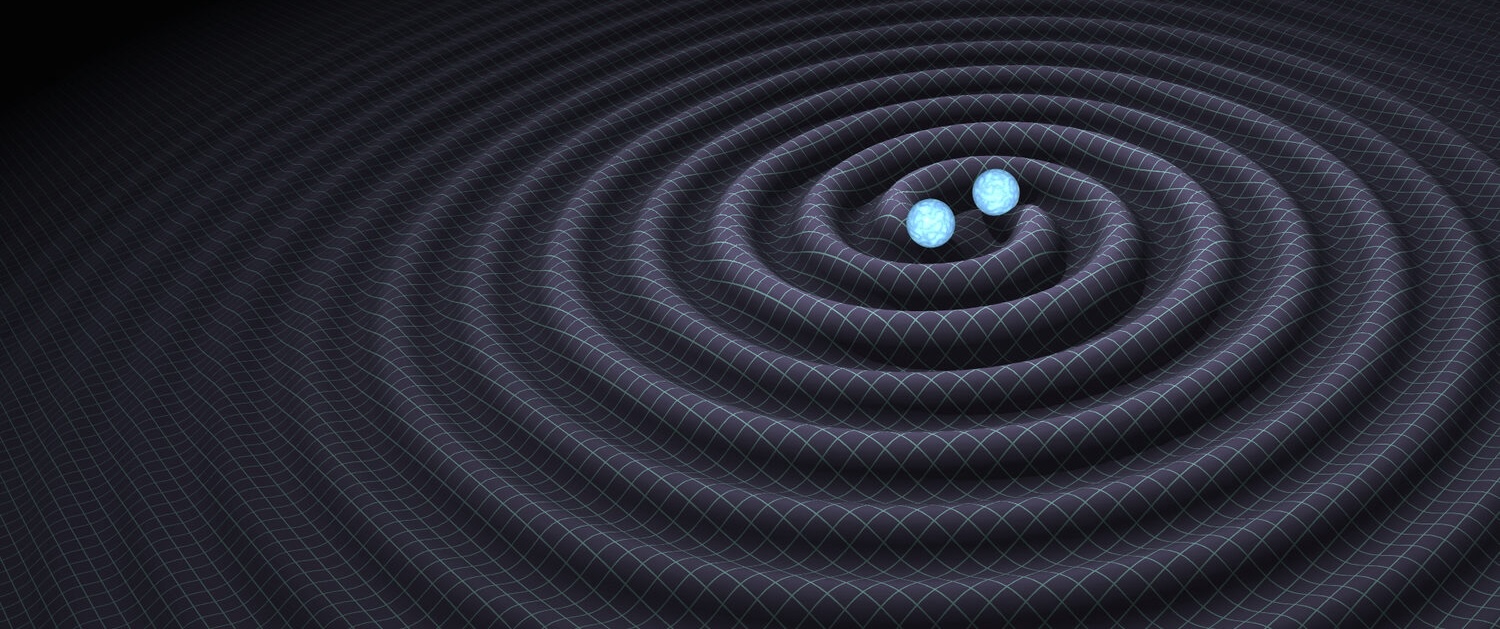
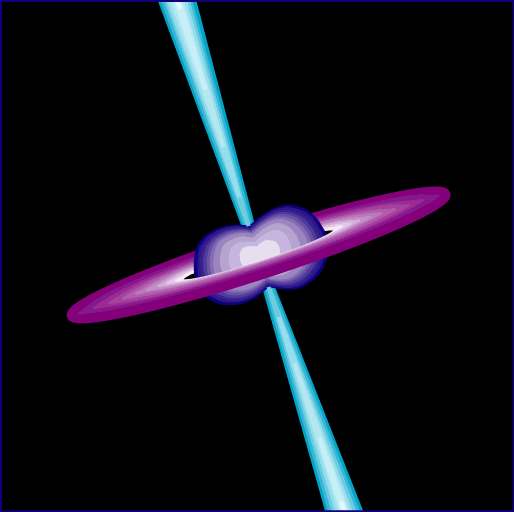
So what could possibly have happened to create such an incredibly energetic explosion? No one really knows for sure but there are two popular explanations for this phenomenon. Most (~85%) gamma-ray bursts of this type are thought to be caused by the collision of two neutron stars (or a neutron star and a black hole) in a process known as a compact binary merger or coalescence. As the bodies orbit, the system emits gravitational waves, losing energy. This loss of energy causes their orbits to shrink and the stars begin to get closer and orbit faster. Eventually, their enormous gravitational fields start tearing each other apart and they merge together and form a black hole. Some material is left over and soon forms a disk orbiting and falling into the black hole. As it gets sucked in, jets of gamma-rays blast through the in-falling matter and create the very brief, intense flash of radiation observed as a GRB. These mergers generate a very distinctive, strong and well understood gravitational wave signature which increases in both pitch and amplitude, much like the chirping a song bird makes. These signals are called ‘chirps’.
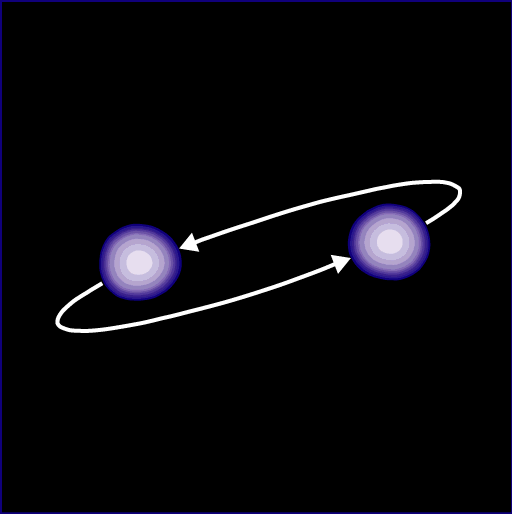
An artist’s impression of a compact binary merger, leading to a gamma-ray burst. [Images:P.J.T. Leonard (NASA/GSFC)]
Another possibility is that these GRBs are explosions near the surfaces of rare objects known as magnetars. These are believed to be neutron stars with enormously strong magnetic fields about a million, billion times more powerful than the Earth’s magnetic field and are the strongest magnets in the universe. The magnetic field lines of these extraordinary objects are complex and twisted and can generate enormous magnetic stresses on the solid crust of the star. Occassionally, these forces build up to the point that they fracture the star’s solid crust. This leads to a sudden rearrangement of the magnetic field releasing a giant explosion of pure energy in the form of gamma-rays. This sudden fracturing of the otherwise rigid crust creates a star-quake. The star vibrates wildly in a family of oscillations much like a bell struck by a hammer except, rather than ringing down and generating sound waves, the oscillation energy is dissipated in the form of gravitational waves. The amount of energy radiated in this sudden burst of gravitational waves is much less than that radiated during a merger and we would not expect to detect the gravitational wave signal from a star-quake on a magnetar in another galaxy.
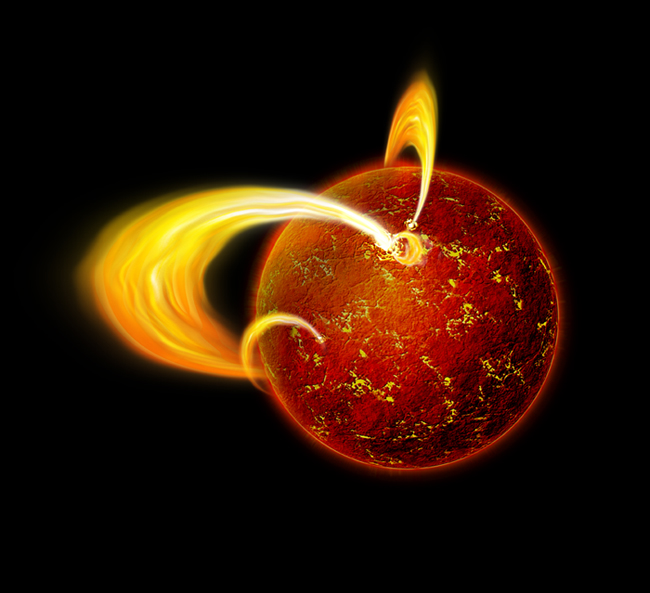
An artist’s impression of giant flare from a magnetar. [Image: NASA/CXC/M.Weiss]
These two scenarios (compact binary coalescence and giant flares from magnetars) can each give rise to very similar electromagnetic signatures but completely different gravitational wave signals. Importantly, if the GRB was indeed caused by the merger of two neutron stars or a neutron star and a black hole in M81 we would expect a very strong gravitational wave signal which would be easily detected.
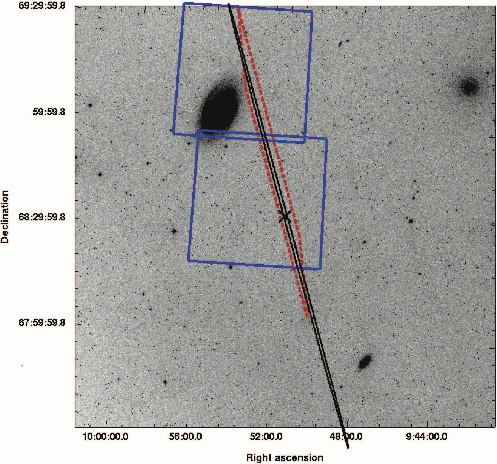
An image from the Sloan Digital Sky Survey showing the area around M81 (the large dark smudge in the upper left) and the probable location of GRB 051103. The red trapezium shows the initial estimate for the region from which the gamma-rays originated. The thinner, longer black ellipse outlines a refined estimate of the GRB-localization region; we are more than 99% certain of this latter estimate. This refined estimate is suggestive that the event occurred in the outer spiral arms of M81. The blue boxes show regions studied by astronomers using optical telescopes to search for glowing remains after the GRB. Figure originally from Hurley et al (2010) Copyright (c) 2010 RAS.
Three separate gravitational wave searches were performed using LIGO data: one looking for the well-understood chirp from the merger signal which is expected to end in the few seconds around the time of the GRB; one targeting the gravitational waves caused by the vibrations of a star-quake in a magnetar associated with some kind of giant flare and, finally, a more general search for unexpected signals a few minutes around the GRB. None of these analyses have yielded a gravitational wave detection. However, this is still an exciting and important result! These measurements allow us to confidently rule out the possibility that this inconceivably violent detonation was due to compact binary coalescence in the galaxy M81. This leaves two possibilities: 1) the GRB was caused by the merger of two neutron stars or a neutron star and black hole at a much greater distance than M81, so the gravitational wave signal is simply too small to be detected; or 2) this was a giant flare in a magnetar where the gravitational wave signal is unlikely to be large enough to be detected. There is already some circumstantial evidence from the electromagnetic spectrum (such as the energetics of the burst and the way the emission evolved in time) which points to this latter option and the case is significantly enhanced by these LIGO observations. If confirmed, this would be the most distant magnetar flare ever observed and only the second such event seen in another galaxy. This work follows on from the similar case of GRB 070201, for which LIGO also provided compelling support for such a hypothesis, and helps pave the way for searches for gravitational waves from GRBs using the latest LIGO and Virgo data.
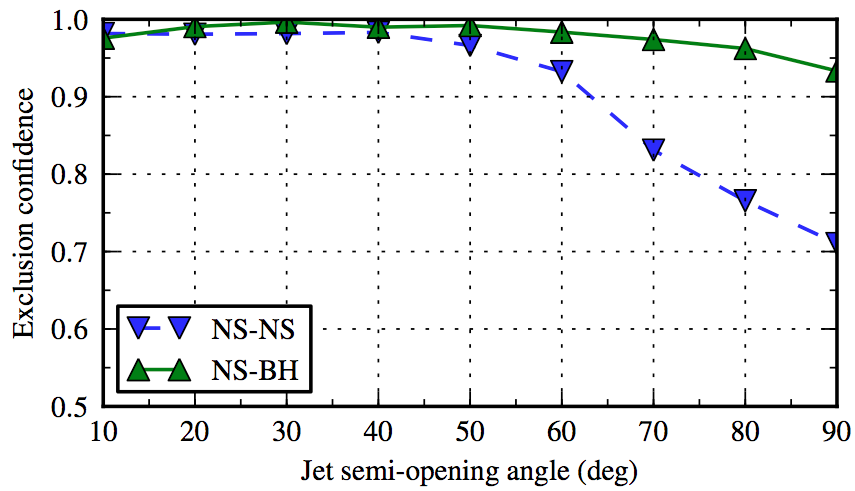
This plot shows how confident (1=absolute certainty, 0=completely unsure) we are that the GRB was not due to a merger in M81 as a function of the width of the jet of gamma-rays from a GRB caused by a compact binary merger. GRB jets are thought to be confined to cones with half-widths up to approximately 30 degrees. In this model, the jets are likely to be centered on the rotational axis of the black hole, which is also the direction from which we expect the strongest gravitational wave signal. Since gamma-rays are promptly detected and the burst duration is short, we are likely to be looking directly into the beam. This then implies that we are also looking close to the rotation axis of the black hole, and will therefore expect a stronger gravitational wave signal. Since no gravitational wave signal was detected in this study, we can be more confident in excluding the merger scenario in M81 for smaller jet angles, where we are viewing the GRB closer to the rotation axis. Similarly, neutron star-black hole systems (NS-BH) produce a stronger signal than systems composed of two neutron stars (NS-NS) making them easier to exclude.
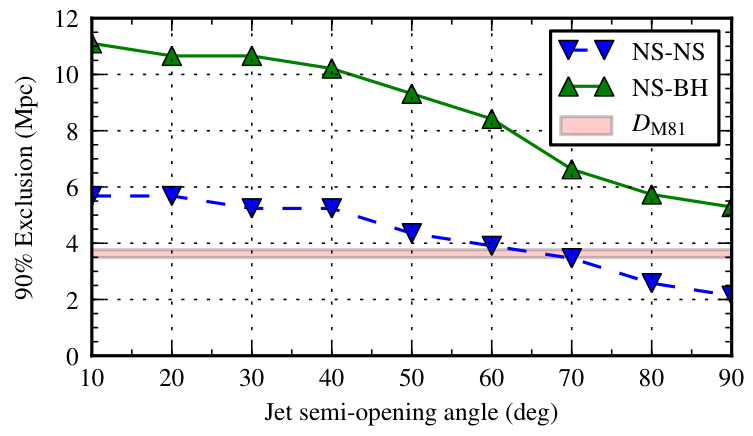
This plot shows up to what distance in megaparsecs we are 90% confident that there was not a gravitational wave signal from the coalescence of two neutron stars or a neutron star and a black hole at the time of GRB 051103. Again, a small jet angle implies that we must be observing the system from a direction where we expect a stronger gravitational wave signal. The lack of a detection allows us to exclude those angles with greater confidence and we can effectively ‘see’ further.
Read more:
- The publication describing the analysis (arXiv)
- Repository of data used in the publication
- Gamma-Ray Bursts: Introduction To A Mystery
- ‘Magnetars’, Soft Gamma-repeaters & Very Strong Magnetic Fields
- An introduction to gravitational waves from compact binary coalescence
- An introduction to gravitational wave bursts